Unstained Negative Control Cells
As depicted in Figure 4 below, the first assay represents data collected from the unstained cells with the following information:
- All Events: As depicted in a density plot, this graph seems to depict a slightly positive correlation between the size of cells (y-axis) to their apparent complexity (x-axis). The red circle highlights the population of cells exhibiting the the characteristics, in size and complexity, of luteal cells.
- R1: The R1 graph focuses on this subset of cells identified as luteal cells, with specific gates to accommodate for doublets, which occur when two small cells are incorrectly sorted together as a larger and more complex cell. The R-2 graphs are based upon this smaller population.
- R2 Graphs: The R-2 graphs depict the gate selected (to the right of the green vertical bar) at 568 nanometers. In a sample stained with TMRM, cells will begin to fluoresce at 488 nanometers. However, since this graph depicts unstained cells, none are found within the gate.
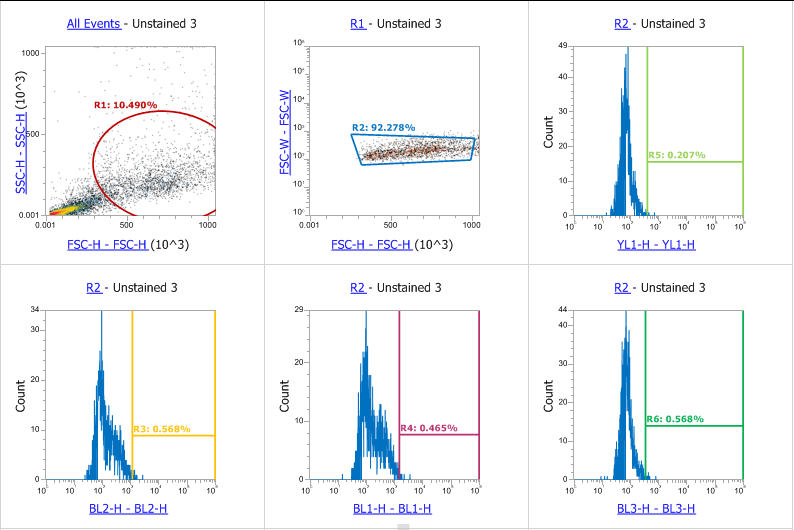
Figure 1: Unstained Cells
TMRM Stained cells
As depicted in Figure 5, this assay presents similar information as described for Figure 4; however, in this case the cells were stained with TMRM. With the staining, there is a quantifiable difference, with the stained luteal cells meeting the gate parameters described above. In comparison to the unstained cells, 88.973 of the TMRM stained cells are fluoresed, as compared to 0.207% of the unstained cells.
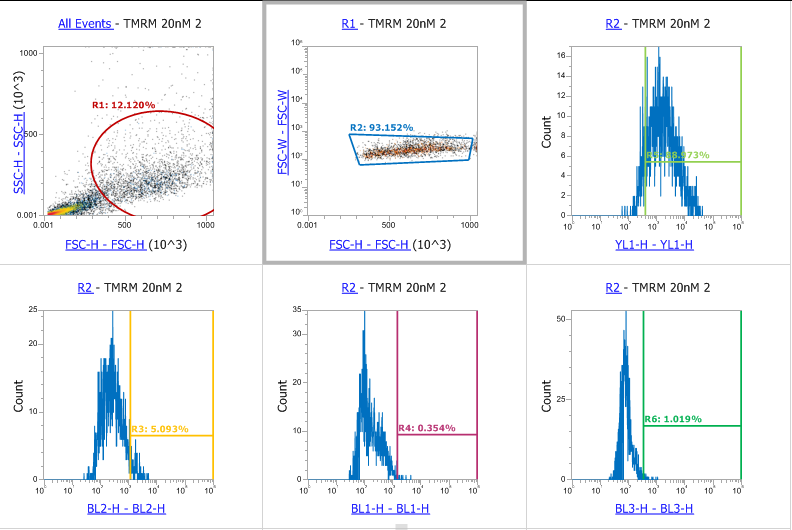
Figure 2: TMRM Stained Cells
CCCP Treated cells
In this third assay portrayed in Figure 6, the CCCP treatment has been added on top of the staining. With only 45.175% of the cells found after CCCP treatment, there is a noticeable reduction in the number cells of cells compared to the 88.973% found after TMRM staining.
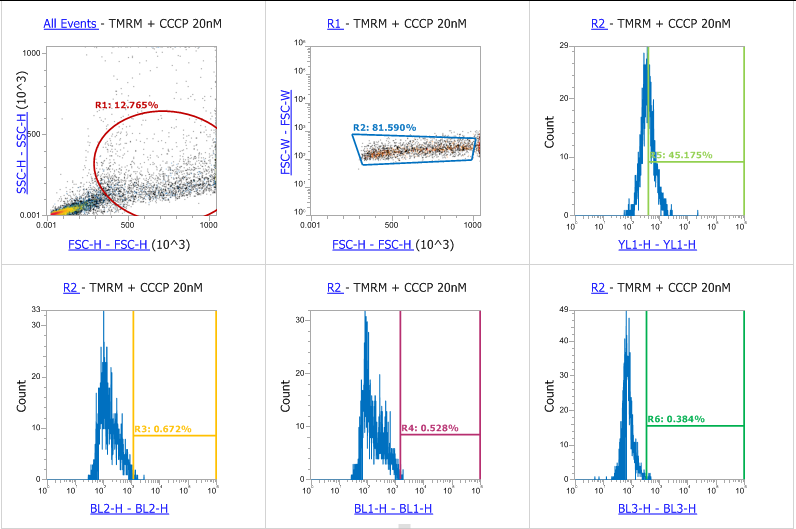
Figure 3: CCCP Treated Cells
