This section discussed observations made through confocal microscopy.
Hour 0 of hypoxia
Figure 1 and 2 are pictures produced with a confocal microscope, which depict the condition of mitochondria from the BSA control. Under normal conditions, healthy mitochondria are long rod shaped organelles. Fragmentation occurs in damaged mitochondria, when small pieces of the organelle break off and form a circular patterns. Hoechst’s Dye targets the nucleus, and stains it bright blue, while TMRM stains mitochondria red. Therefore, greater mitochondrial potential is demonstrated with an increasing intensity of red fluorescence. Figure 1 (closeup) and 2 depict a healthy mitochondria, with high intensity red fluorescing.
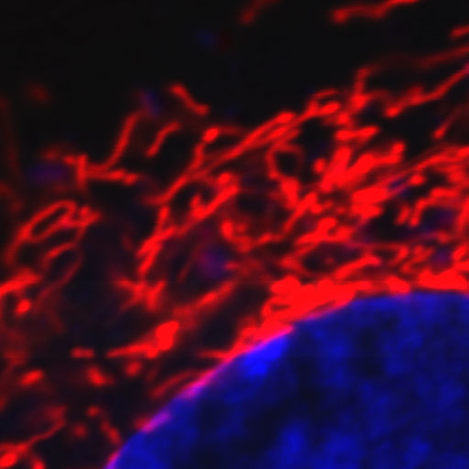
Figure 1: BSA Treated Cell-Fragmented Mitochondria
|
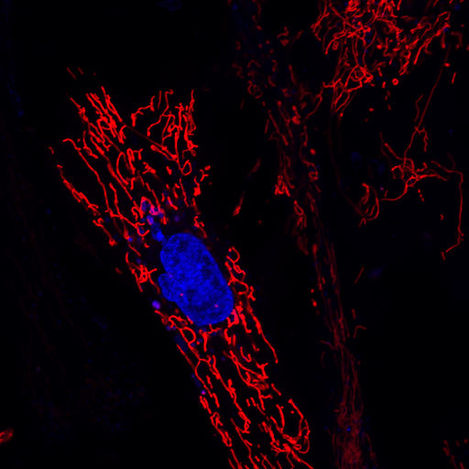
Figure 2: BSA Treated Cell-Unfragmented Mitochondria
|
However, Figure 3 depicts an unhealthy cell that was treated with CCCP and then dyed with TMRM. Note, neither nucleus (blue) or the mitochondria (red) are fluorescing significantly. This was expected, because this sample was treated with CCCP, which destroys the mitochondria and nuclear material.
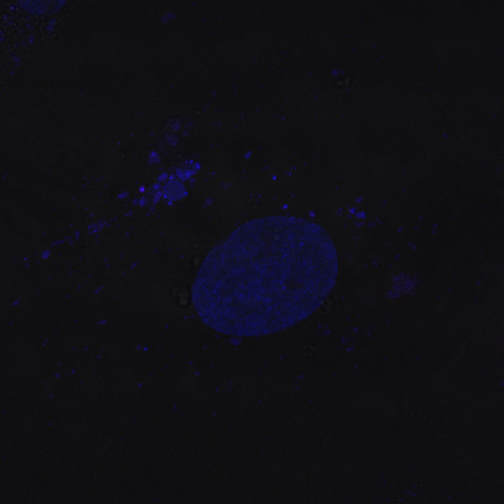
Figure 3: CCCP treated cells
Figure 4 and Figure 5 portray cells treated with fish oil and vegetable oil respectively, and then dyed with TMRM. In both cases, the cells exhibit higher intensity reds and blues indicating increased viability through a higher mitochondrial membrane potential. From a qualitative standpoint, the fish oil treated cell (Figure 4) appears to be more intense than the vegetable oil (Figure 5) treated cell.
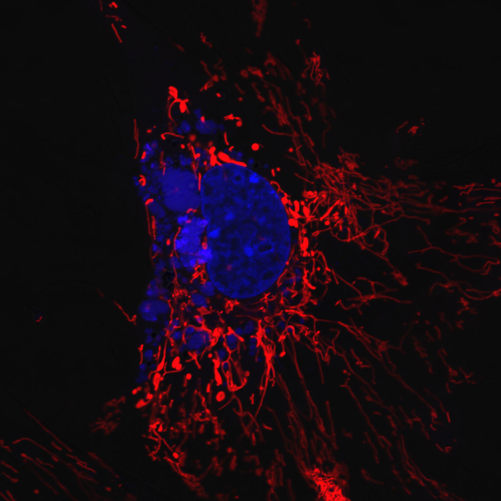
Figure 4: Fish Oil Treated Cell
|
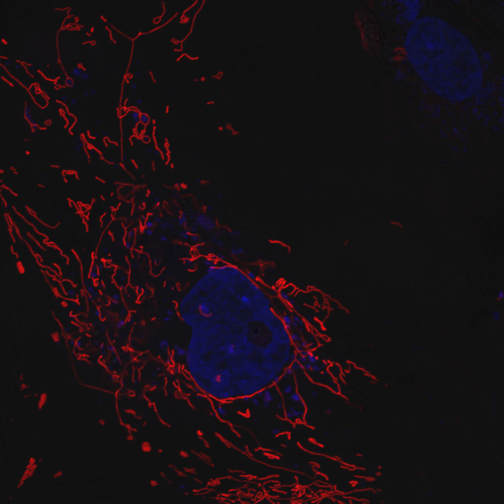
Figure 5: Vegetable Oil Treated Cell
|
Figure 12, depicts an unstained cell, for comparative purposes.
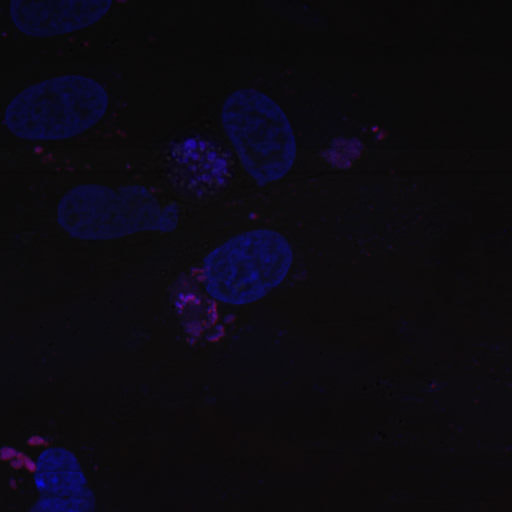
Figure 6: Unstained Cells
Results of hypoxia at 5%
Figure 13 depicts a cell treated with BSA then TMRM. The lack of TMRM fluorescence intensity indicates that the mitochondria have become depolarized due to the lack of oxygen, and are no longer viable.
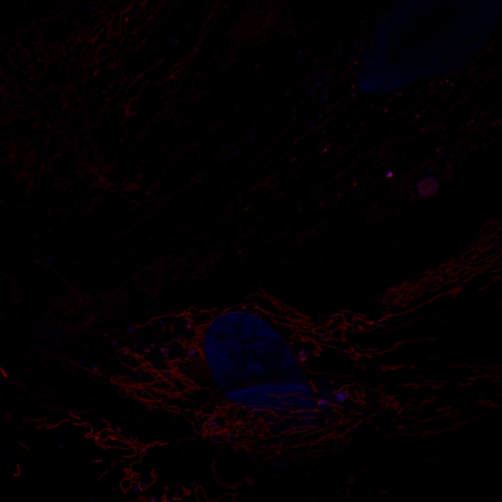
Figure 7: Cell treated with BSA then dyed with TMRM
Figure 8 depicts a cell treated with BSA then TMRM, which, from the lack of fluorescence, appears nonviable.
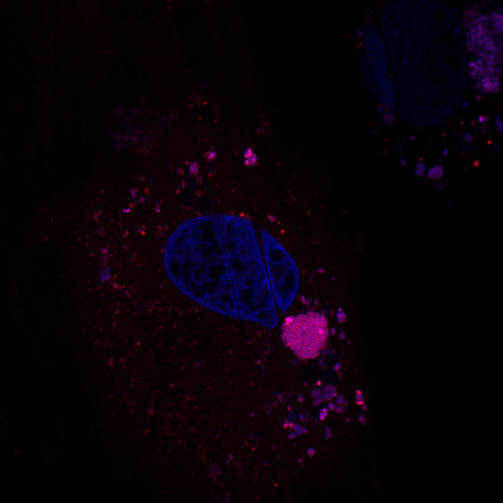
Figure 8: Cell treated with CCCP and then dyed with TMRM.
Figure 9 and 10 depict cells treated with fish oil and vegetable oil, respectively, and then with TMRM. While in both cases, fluorescence significantly increases over those cells not treated, the fish oil treated cell is remarkably more vivid.
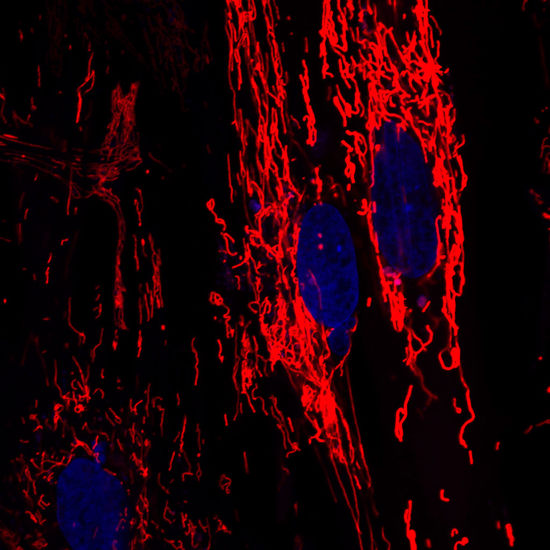
Figure 9: Cell treated with Fish Oil
|
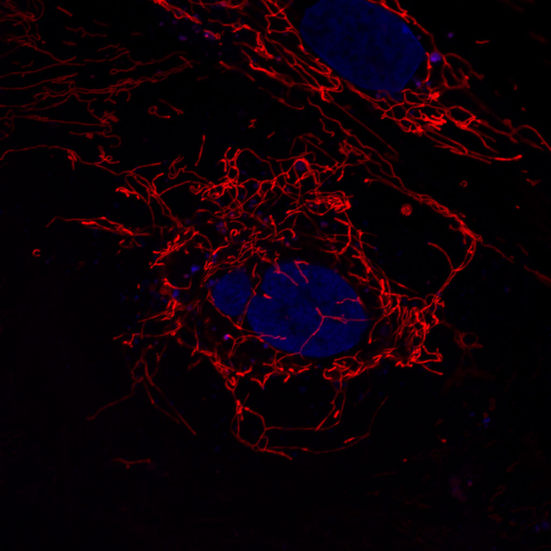
Figure 10: Cell treated with Vegetable Oil
|
In Figure 17, depicts an unstained cell from the 5% oxygenated environment, These cells do not have any fluorescence because they were not exposed to the TMRM dye as the other cells were.
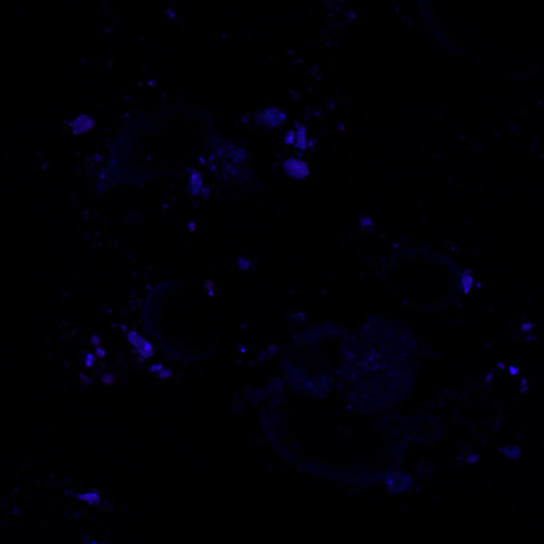
Figure 11: 5% Oxygenated Cell
Cells grown in 20% oxygenated Environments
Both Figures 12 and 13 depict cells treated with BSA and then dyed with TMRM. In a more oxygenated environment, versus the 5% environment, the mitochondria are more vivid and show more mitochondrial membrane potential. However, Figure 18 does epitomize the fragmentation which was discussed earlier.

Figure 12: BSA treated cell with fragmentation
|
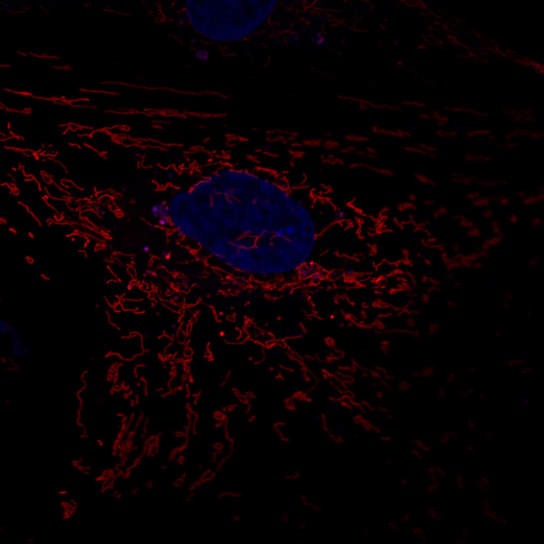
Figure 13: BSA treated
|
Figure 14 depicts CCCP and TMRM treated cells. As opposed to the cells treated with CCCP and TMRM in a 5% oxygenated environment, refer to Figure 5, these cells appear to be polarized and as vivid as the fish oil treated cells. Refer to the discussion section to see possible sources of error.
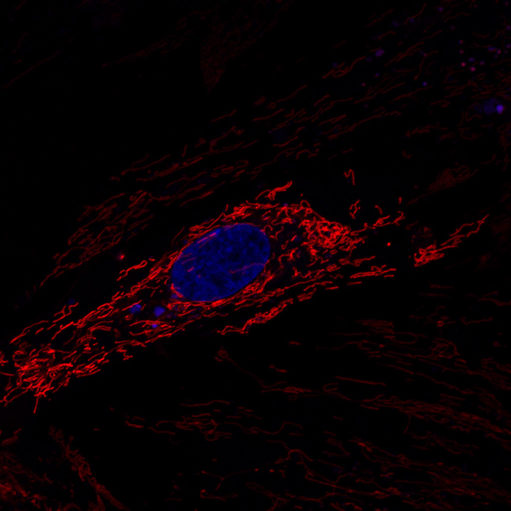
Figure 14
Figure 14 depicts CCCP and TMRM treated cells. As opposed to the cells treated with CCCP and TMRM in a 5% oxygenated environment, refer to Figure 8, these cells appear to be polarized and as vivid as the fish oil treated cells. Refer to the discussion section to see possible sources of error.
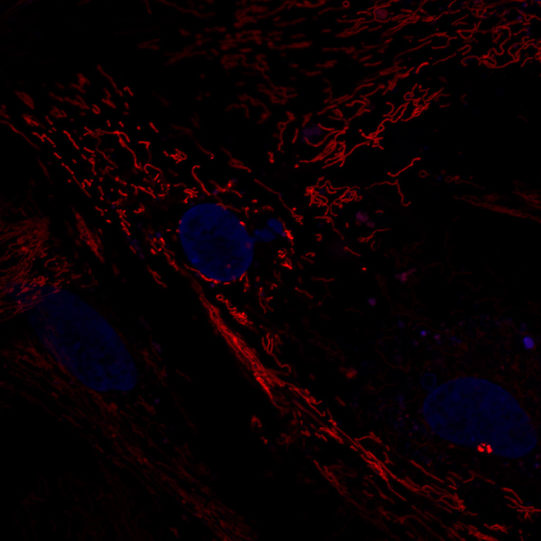
Figure 15
|
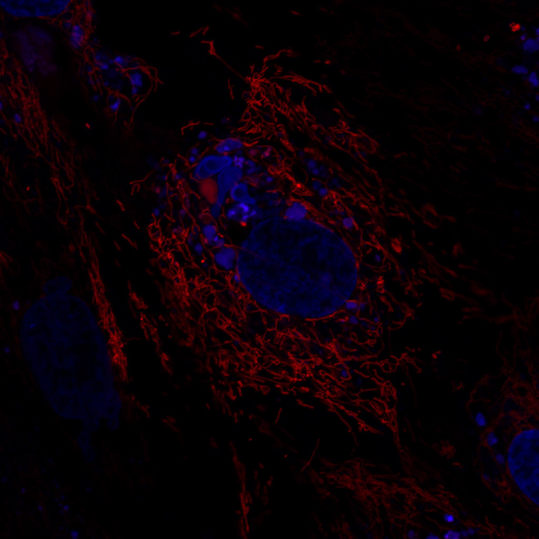
Figure 16
|
Figure 17 depicts an unstained cell, for comparative purposes.
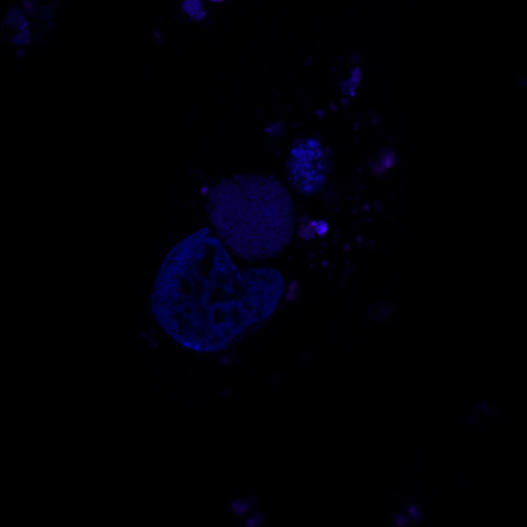
Figure 17: Unstained Cell
